Software Performance: CPU
Performance is a vast and tangled topic. From code, to network, to deployment — performance touches everything. There is no shortage of articles on the subject, covering principles, methodologies, and tooling in fine detail. This piece won’t entirely escape that mold, but it tries to look at performance from a slightly different angle: performance from the hardware’s point of view.
To talk about high performance, you have to first nail down: what does “high performance” actually mean?
Is it hundreds of millions of QPS per second? Multi-gigabyte-per-second data throughput? Sure, those are quantitative markers of high performance. But I want to define it more fundamentally. The core demand of high performance is this: direct hardware resources at the core business logic. Unpacked:
- Resource utilization — the program should fully exploit available hardware. The performance ceiling you hit should be the hardware’s, not the software’s.
- Resource efficiency — accomplish the same work with fewer resources, with hardware spent on the core business path rather than overhead.
So how do you actually achieve that?
There’s a famous line in the industry: premature optimization is the root of all evil. I’d like to add a corollary: early consideration of performance is the foundation of efficiency. Before you write the first line of code, you should already know what a high-performance design looks like — not return to optimize after the features ship. Performance has to live at the back of your mind through every detail. Trying to optimize after the fact runs into two characteristic failures:
- Some performance problems are baked into the structure. Changing them ripples everywhere; the cost of refactoring is high; ignoring the issue isn’t really an option either.
- There’s no concentrated bottleneck — every layer takes a not-too-long, not-too-short slice of time. Final performance ends up middling, and there’s no obvious place to push.
This piece looks at how to squeeze hardware from a few different angles. Part one: CPU.
Anatomy of a Modern CPU
A modern CPU is a deeply layered, heavily optimized system, designed around two goals: maximize compute efficiency and maximize resource utilization. The headlines:
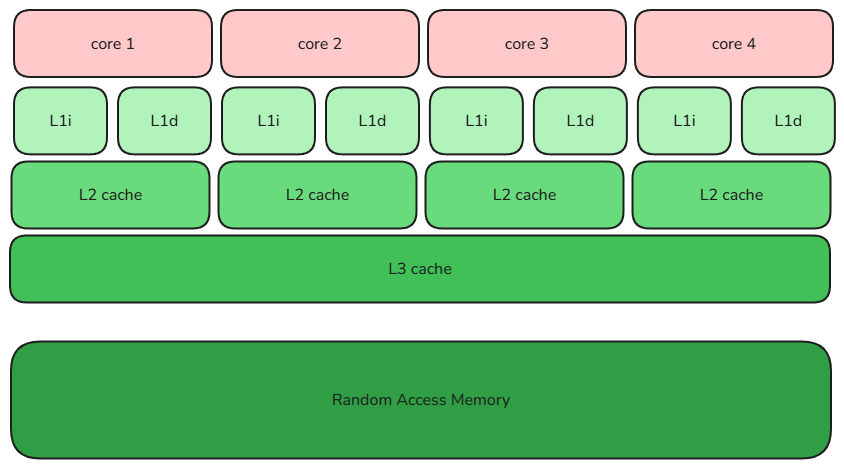
- Multi-core. Modern CPUs ship with multiple physical cores, each capable of executing instructions independently. Hyper-threading further virtualizes a physical core into multiple logical cores that share the core’s execution units and caches.
- Instruction pipeline. Each instruction is broken into stages — fetch, decode, execute, memory access, write-back — and stages run in parallel to improve throughput. Data dependencies and branch mispredictions cause pipeline stalls.
- Multi-level cache. L1 splits into instruction cache (L1i) and data cache (L1d), private to each core, with a 1–3 cycle access latency. L2 sits at roughly 10 cycles and is either private or shared. L3 is shared across cores, around 30–50 cycles. Each successive level is larger and slower. Cache-line state tracking ensures coherence across cores so dirty reads don’t happen.
A simple multi-core, multi-level-cache picture:
With this much background, we can start asking how to exploit each of those features for performance.
Using Multiple Cores Effectively
Modern operating systems schedule CPU time slices at thread granularity. To exploit multi-core, you need multiple threads.
Linux models each thread as a task. A task carries its own stack, its own snapshot of CPU register context (the bit that makes preemption possible), plus other metadata. In principle, the right number of threads roughly tracks the number of cores. But applications don’t have a direct relationship with the CPU — the OS sits in between with its own scheduler and its own kernel processes. The old Programming Applications for Microsoft Windows line was “use 2× the core count.” But whatever the multiplier, neither too many threads nor too few works well.
The OS has to schedule fairly and efficiently — every thread must get a chance on the CPU. Some threads are CPU-bound; others spend most of their time on I/O. The OS allocates time slices accordingly. Roughly: CPU-bound threads get scheduled less often but with larger slices; I/O-bound threads get scheduled more often with smaller slices. The more threads you spawn, the more candidates the scheduler has to evaluate. Too few threads, of course, leaves cores idle.
How does the OS know whether a thread is CPU- or I/O-bound? It doesn’t, exactly. Neither classification is a hard property — CPU work can pause for I/O, I/O can interleave with computation. The OS infers behavior from observed statistics.
Here’s a concrete consequence. A thread blocks on send to a socket. A send call can finish quickly (a copy from user-space to the kernel send buffer) or take a long time (waiting for the protocol stack to flush enough so the buffer has room). From the application’s perspective, send simply blocked the thread. The OS is aware of that block — it marks the thread as blocked and yields the CPU.
The harder question: when does the OS know send has progressed and the thread should be woken? That requires a hardware interrupt to re-trigger the scheduler. If you only call blocking I/O primitives, when the thread eventually wakes up is at the OS’s discretion — could be quick, could be slow, but unlikely to be optimally timed. To really push CPU utilization, you have to avoid blocking system calls. Modern OSes provide async/event-driven APIs for this — that’s a topic for another piece.
In short: how many threads is “right” isn’t a simple question. It depends on hardware, on workload shape, on the amount of I/O versus compute. Decide based on the situation, not a formula.
Using Caches Effectively
Each round trip between the CPU and main memory takes nearly a hundred CPU cycles. If every memory access went straight to main memory, the CPU would spend most of its time waiting on data. The three-level cache hierarchy fixes this — L1 closest to the core, fastest, with each successive level slower. L1 and L2 are typically core-private; L3 is shared, with its own coherence algorithm. (Curious readers can dig deeper; this isn’t the place for it.)
From the CPU’s perspective, every thread is just data plus instructions. Boosting cache hit rate works the same way it does in everyday programming: increase locality, reduce misses. The difference: ordinary memory operations are explicit — you know which line accesses which structure — but CPU caching isn’t that visible. The unit of cache transfer is a cache line, typically 64 bytes. From a coding perspective, a few moves help:
-
Avoid frequent thread switching. Each thread carries its own context — different data, different instructions — so swapping threads on the same core invalidates a lot of recent cache. Modern OSes provide APIs to pin a thread to a specific core, keeping L1/L2 caches warm for that thread. (Linux: CPU affinity /
pthread_setaffinity_npand friends.) -
Access neighboring memory. Improving cache-line utilization cuts down on transfers. Take a 2D array:
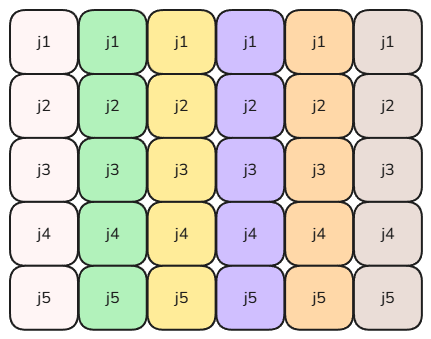
Different colored columns represent contiguous regions of the second dimension. A common shape. Walking horizontally accesses non-contiguous memory — once your
jindex span exceeds a cache line, every step needs a new line loaded. Walking vertically accesses contiguous memory; one cache line holds many useful values. The code looks identical at the source level, but to the CPU the column-wise traversal slashes cache-line traffic and lifts throughput substantially. -
Avoid local-data sharing across threads. It’s well-known that multiple threads writing the same variable causes contention and demands locking. What about threads writing adjacent variables?
struct Data {
    int32_t param_a_;
    int32_t param_b_;
};
When thread A reads/writes
param_a_and thread B reads/writesparam_b_, the cache line is 64 bytes and the CPU updates cache at line granularity. Thread A’s access pullsparam_b_along with it; thread B’s access does the same in reverse. Whenever one core writes, the other core’s copy of the line is invalidated to maintain coherence — what you’ve manufactured is a false sharing disaster, lots of cache-line ping-pong even though the threads aren’t actually contending for the same data.The fix is to isolate access at the cache-line level: align critical fields to 64 bytes, or use thread-local storage to remove the contention entirely. The thread-local approach is more complex than centralized data, of course.
Improving Branch Prediction Accuracy
Structured programming is essentially branching, and our code is full of if/else. From a feature standpoint, one extra branch or one rearranged check is harmless. From the CPU’s standpoint, a mispredicted branch costs tens or hundreds of clock cycles as the pipeline drains. Improving branch predictability is a real lever.
A few code-level moves help:
- Reduce branches; combine conditions. The most direct way to lower misprediction rate.
- Make branches locally predictable. If you traverse an integer array running A on evens and B on odds, sorting the array so even elements come first and odd ones after dramatically improves branch predictability.
- Put hot paths first. The branch most likely to be taken should be the one tested first.
- Replace tangled
if/elsewith lookup tables when it makes sense.
Performance optimization is its own deep field. This piece has approached it from the CPU side and barely scratched the surface. I plan to follow up with one focused on I/O.
If anything here was useful, I’m happy. If you’ve got your own CPU-utilization tricks I haven’t covered, I’d be glad to compare notes.